Learn in Bionic Academy: Monitor Ad Delivery Pacing
Bionic for Agencies gives you a complete system for tracking ad delivery pacing across all media channels, online and offline.
Under the Performance tab you'll be able to analyze data based on how your ads are doing. Here you'll be able to view KPI data showing planned and actual figures, emojis to help identify how on pace a specific KPI is, and charts to provide further detail on performance.
You can also analyze placement performance data from the Flowchart Tab and manage fluid budgets in the Media Plan Tab.
Table of Contents
- Report Ad Delivery Pacing
- Download Performance Reports
- Analyze Placement Performance Data via Flowchart
- Manage Fluid Budgets
Report Ad Delivery Pacing
When your Ads start running, assuming you have Integrated Performance Data, Bionic automatically gathers this data and has ready for you all of the pacing reports through yesterday.
Here is how to report ad delivery pacing in Bionic:
- Click on Performance tab from the Organizational, Advertiser, Campaign or Placement level.
Whenever you open the Performance tab, no matter which level you are viewing, you will be brought to the Performance table. However, the level that you are viewing will determine the data that will be displayed.
- At the Organization level the table view will show you performance by Advertiser.
- At the Advertiser level the table view will show you performance by Campaign for that Advertiser.
- At the Campaign level the table view will show you performance by placement for that Campaign.
- At the Placement level the table view will show you an overview of performance for that placement.
From the Home Page (Organizational Level)

From the Placement Level (Access from the Placement Digest in the Media Plan)

There are two views in the Performance Tab:
Performance Table
Here you will be able to view a grid of performance data for the particular level you are viewing. The grid includes name of the applicable level (Advertisers, Campaigns, Placements), Period Start & End, and a full list of associated KPIs (including both cost and quantity). The table view can be filtered to only include information that you want to see.
- Use the filters to narrow down your view.
- Clicking on the name in first column of the table will bring you down to the next level data.
- Hover over the Emoji to get more detailed information.


NOTE: Here is a breakdown of what each emoji represents (colors/faces are based upon pacing percentage):
| Pacing Value | Color Code | Emoji |
| pace > +25% | green | |
| +10% <= pace < +25% | green | |
| 0% <= pace < +10% | standard (dark gray) | |
| -10% < pace < 0% | standard (dark gray) | |
| -25% < pace <= -10% | yellow | |
| pace < - 25% | red |
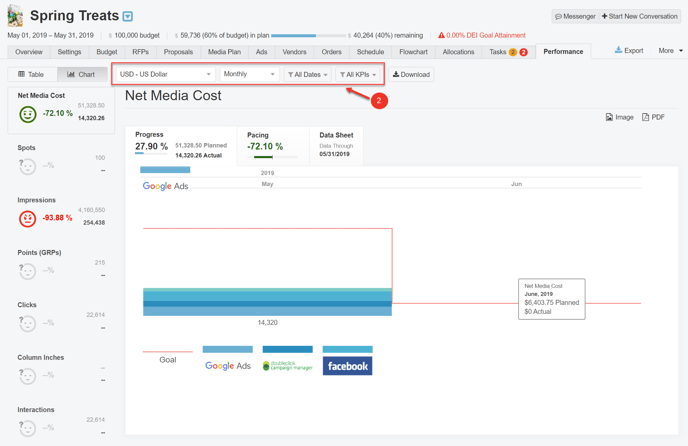
Performance Chart
The other view that is available is the Chart view. Here you will be able to view a variety of charts for each KPI that you are tracking, including: Progress, Pacing, and Cost charts. All charts will show more detailed information when hovering over the bars.
- Accessing this view by:
- Clicking through on any of the values within the performance table (this will bring you to the chart view for that specific level & KPI).
- Clicking on the Chart toggle just above the Performance table.
- Charts can be adjusted by filter options.

Download Performance Reports
Performance data can be downloaded as an Excel, Image or PDF.
Download File(s):
-
In the Performance Tab, click on the Download button next to the filter options or Iin Chart View, click on the Image or PDF button to download.

Analyze Placement Performance Data via Flowchart
For each KPI tracked you will have a planned and an actual Display Value option that can be included in your flowchart. In a flowchart, use the Display Values to display the planned and actuals of your KPIs or spend.
Learn more here: Configure Your Flowchart
NOTE: Actual display values can be included in flowcharts at the Campaign and Advertiser levels.
Manage Fluid Budgets
Bionic enables you to automatically flow your media budgets from month-to-month by comparing your planned against actual net media cost by month in your media plan. Bionic automatically calculates your variance and pace across your entire media plan.
Learn more here: Manage Fluid Budgets.