Once you have your proposal built out, you can access a calendar view of it in the Flowchart tab. The flowchart view provides customization options to help you visualize the proposal in a way that meets your needs. Flowcharts can also be exported for offline access.
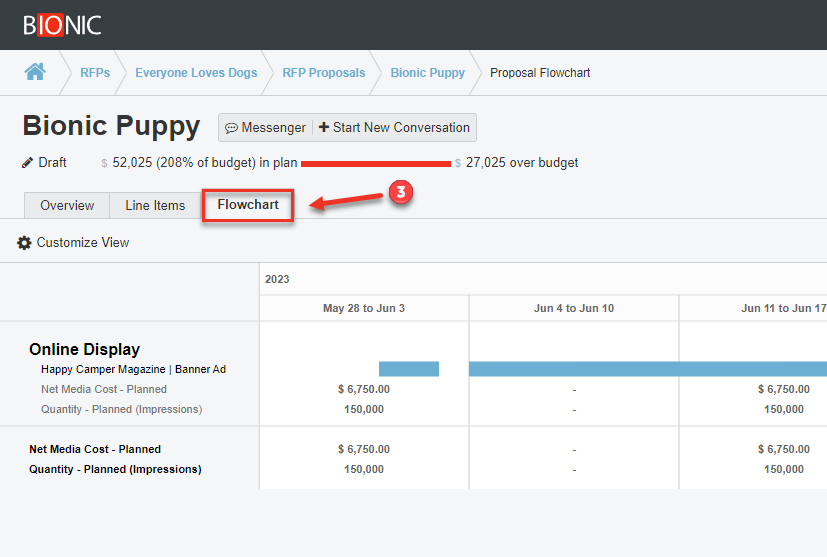
Access the Flowchart Tab
- Log in to Bionic for Ad Sales
- Go to your Proposal
- Select the Flowchart tab
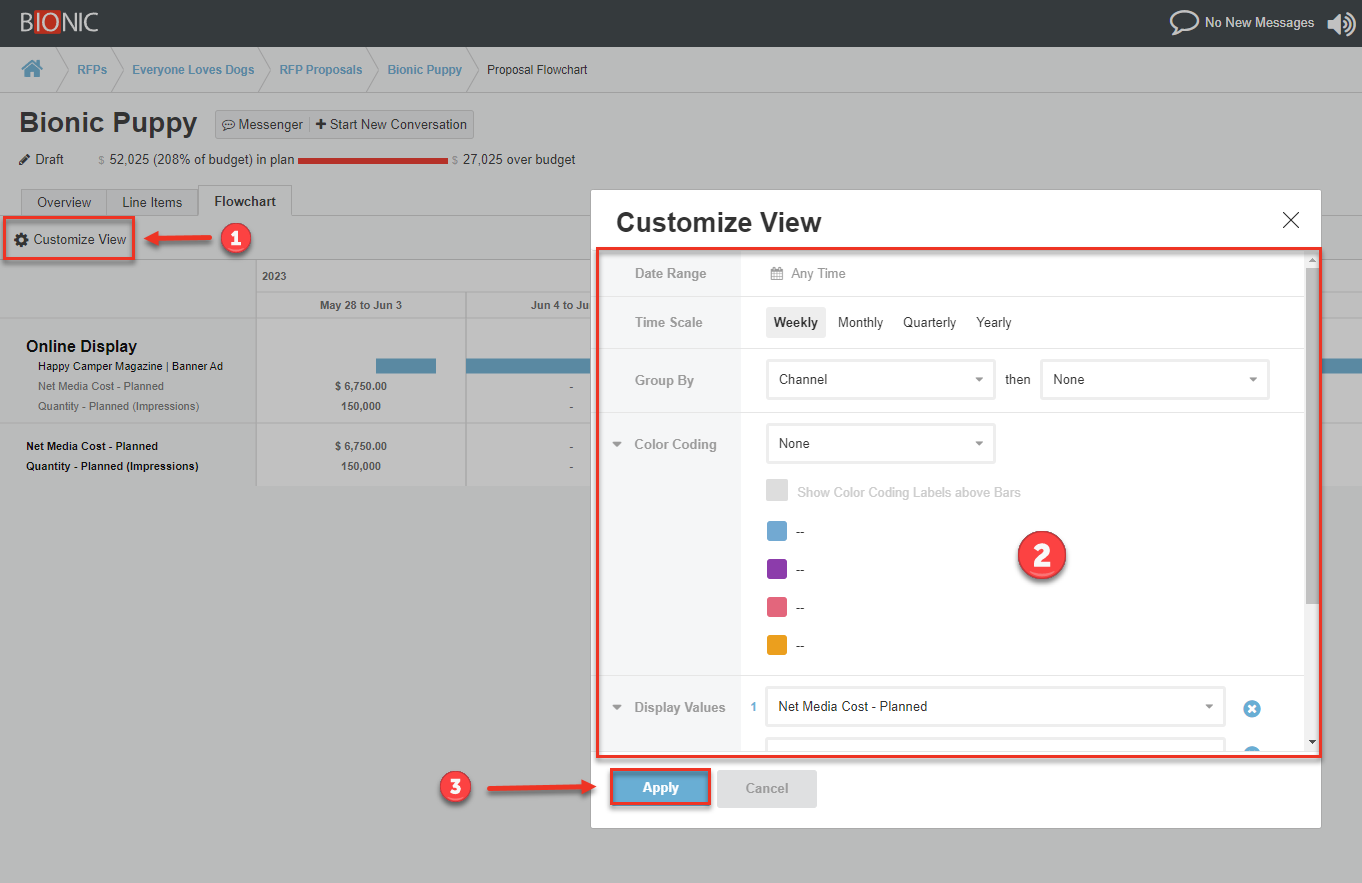
Customize the View
- Press the Customize View button
- Select the view options to best suit your needs
- Date Range - Filter the dates displayed & choose between standard or broadcast calendar.
- Time Scale - Adjusts the breakout of the data by Week, Month, Quarter, Year. If you are using a broadcast calendar, Monthly will also include broadcast weeks.
- Group By - Select up to 2 fields to group your data by.
- Color Coding - Select a field you want to highlight by using color to distinguish between values. Select the Show Color Coding Labels option to include the text value in the content.
- Display Values - Choose the quantities and costs you want to display in the flowchart.
- Placements - This will determine whether placement details are presented. If not selected, placement details will be hidden and data will summarize based on your group by options.
- Placement Text - Wrap Multiple Lines will ensure the left bar text wraps to the next line. Otherwise longer placement names will be cut off.
- Press Apply
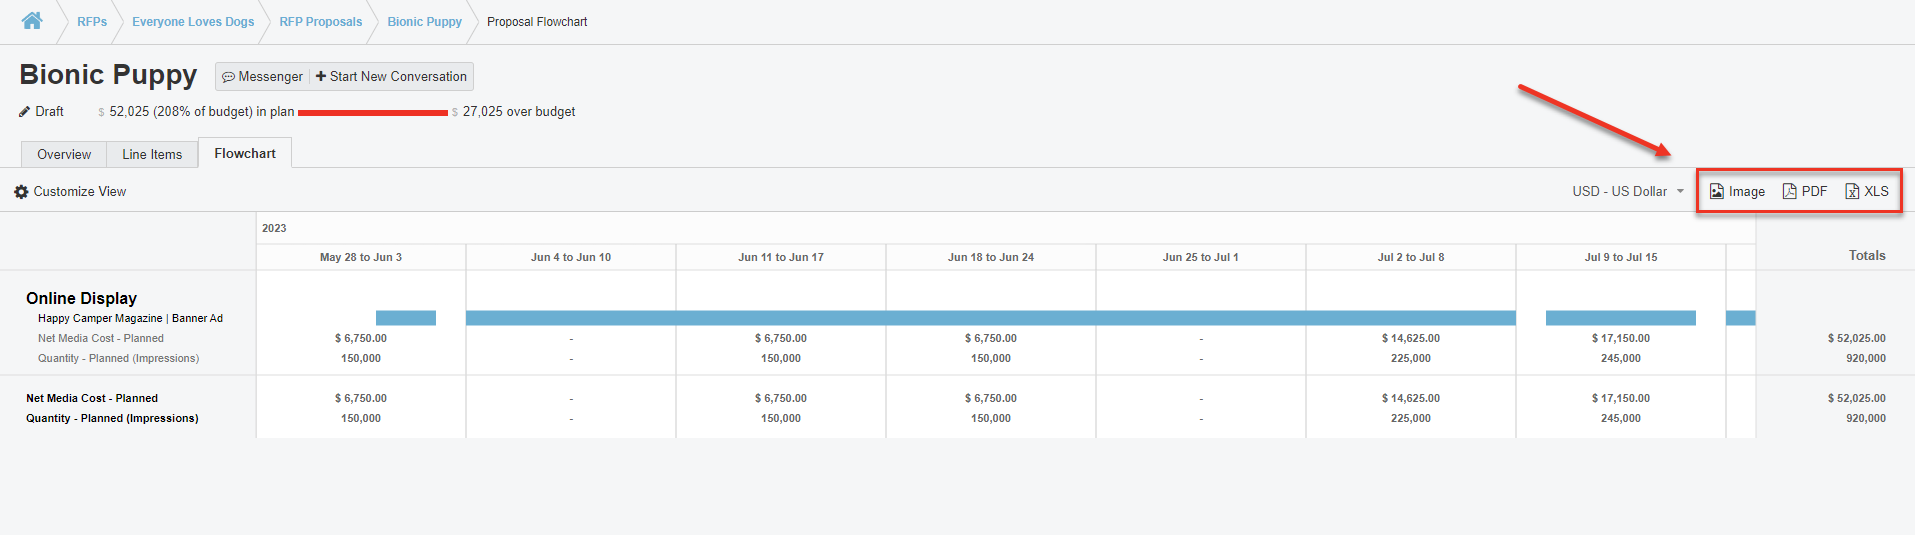
Download the Flowchart
You can export your flowchart to access outside of Bionic using the export buttons to create Image, PDF, or XLS files.