Analyze Your Media Buying Patterns
Here's How to Analyze Media Buying Patterns in Bionic for Agencies.
Learn in Bionic Academy: Manage Media Plans
The Bionic Allocations feature helps you see a breakdown of how your media plan budget is allocated across various attributes.
Allocations provide a breakdown of where and how various attributes of your media plan(s) have been allocated. These allocation charts can be exported to an image or PDF file. Allocations are available for all major attributes of your plan, including broadcast markets and custom columns.
In this article, we'll cover:
Get Allocations Charts
Bionic automatically starts developing your Allocation charts when you start building out your media plans. Here's how to access your Allocations Chart:
- From the Home Page, click on the Allocations Tab.
NOTE: You can also access your Allocations Tab from the Advertiser or Campaign level which will display allocations related to that Advertiser or Campaign.

Switch Chart View
Now that you are in the Allocations tab, you can select your chart view:
- Click on any of the Attributes at the left hand side to display the respective allocations.

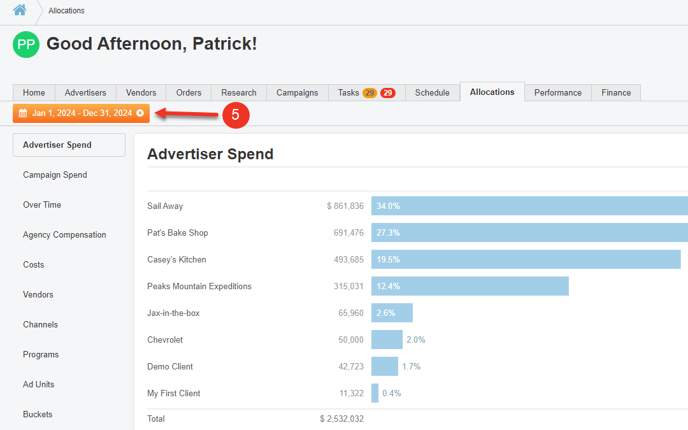
Add a Date Filter
You can limit the view to a specific time frame.
- Click on Any Time to expand the date filter.
- Identify the applicable time frame to limit the Allocations to.
- Select the Calendar Type: Standard or Broadcast.
- Press Apply. The Allocations will display the data limited to the time frame specified.
- Press the X next to the Date filter to remove the filter and view all data.


View Line Items
When viewing Allocations from a Campaign, you can click on any of the values to access a filtered view of the media plan line items that it represents.
For example, [1] in the Channels Allocations Attribute, clicking on Online Display to see all line items that have an Online Display channel. The media plan view will automatically display, [2] filtered to the specific line items with Online Display channel.

