Bionic provides a platform used by media teams to manage their media campaigns. These teams are researching new opportunities and deciding where their clients should be advertising. The Performance tab will help to give you an overview of activity happening in Bionic from your programs within these media campaigns.
Note: The chart compares your company against the entire database of vendors (Everyone) and calculates your share of the total.
Tip: This page represents overall activity across all of your programs. To see Placement Quantity and Revenue for specific programs, click on the Programs tab.
View and Understand Performance
- Log in to Bionic for Ad Sales
- Click on the Performance tab.
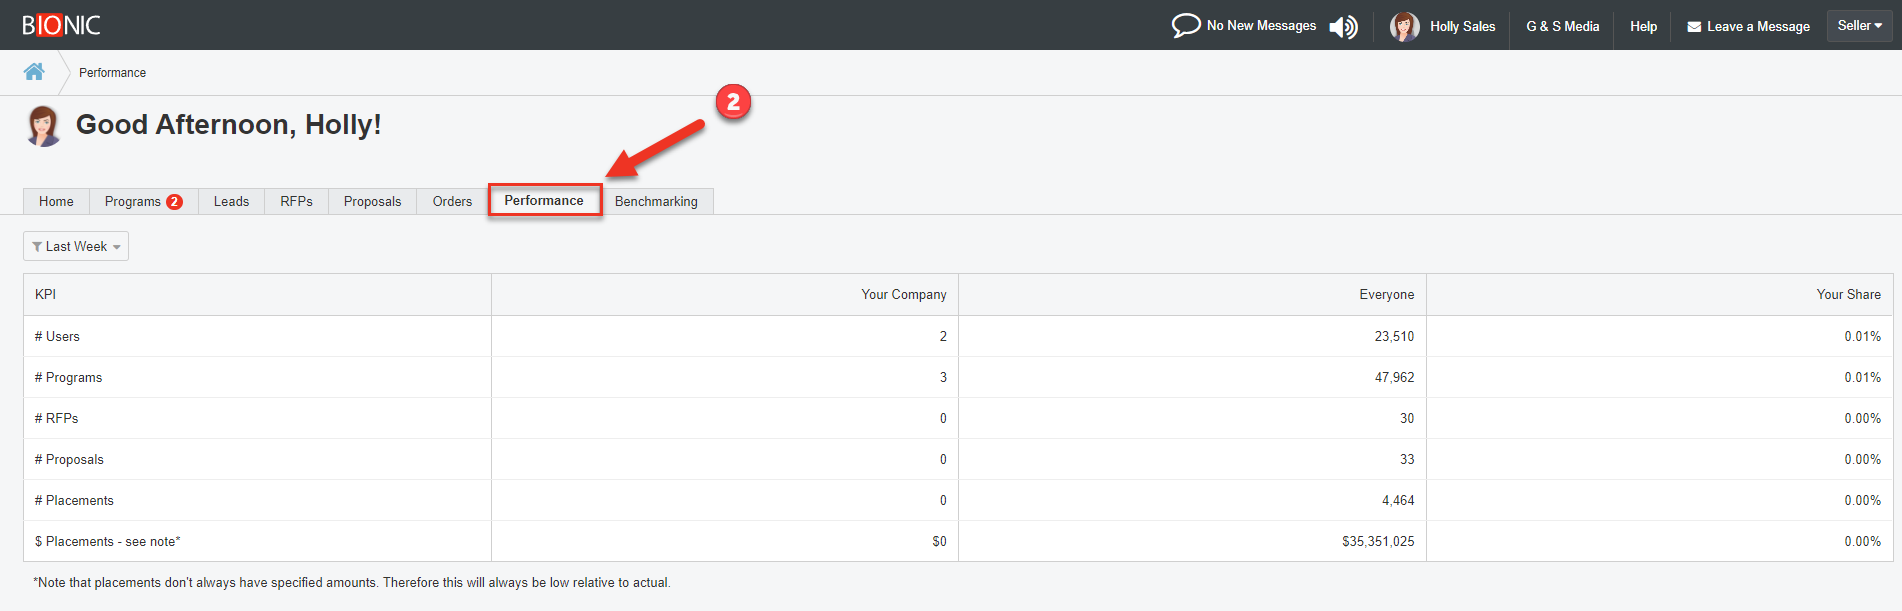
- # Users - While not specific to programs, this will help you understand the number of users in your company that have access to Bionic. Most users have this access because they have needed to respond to RFPs or receive Orders sent via Bionic.
- # Programs - The total number of Programs you have under your portfolio in Bionic.
- # RFPs - The total number of RFPs you have received in Bionic. These only include RFPs generated through the platform, and not RFPs that may have been sent via email even if the planner uses Bionic. It is likely this number is lower than the actual number of RFPs you have received by users of Bionic.
- # Proposals - The total number of proposals sent by your company's sales team in response to RFPs they received through the Bionic platform.
- # Placements - The total number of placements your programs have been added to in media plans generated through Bionic.
- $ Placements - The total cost of placements that have been added to Bionic. Note that not all agencies track cost, so this value may be lower than the actual spend.